As thePhysical Climate Change increase in severity and frequency, awareness of how they affect individuals, companies, and financial institutions is becoming more mainstream. While some data and tools are available for governments and individuals to assess their exposure to physical climate risks,1 institutional investors face unique challenges around making informed decisions on physical climate risk. They must assess physical climate risk at a global scale. And they must consider a wide range of mechanisms through which physical climate risks impact their investments across the value chain. Additionally, investors must manage and assess risks on varied time scales, depending on how their investments are structured.
Despite these complexities, institutional investors need clear insights into how physical climate change may impact their investments, both today and in the future. As with other risk channels, such as market and regulatory risks, investors require granular data to be able to make informed financial decisions and remain competitive. And they need to translate physical climate risks into an assessment of the resulting material financial impact on their portfolio companies.
Impacts on Companies
The impacts of physical climate risks can create a significant drain on company finances. The costs of damage to physical assets, along with lost revenue, will negatively affect a company’s bottom line. Figure 1 below shows an assessment of cumulative projected losses compared to projected operating cash flows from now to 2050, based on one possible climate change scenario. The average (mean) value for each sector shows that many are vulnerable to significant losses from physical climate risks. In particular, the average utilities and energy companies in the product universe may experience cumulative losses of over US$20 billion between now and 2050 in a hot house world scenario (RCP8.5) where global emissions continue to rise throughout the century. Investors should examine their portfolio companies to understand how they may be affected.
Figure 1: Average Cumulative Operating Cash Flow Versus Average Direct and Indirect Damage Losses in a Hot House World Scenario (RCP8.5) 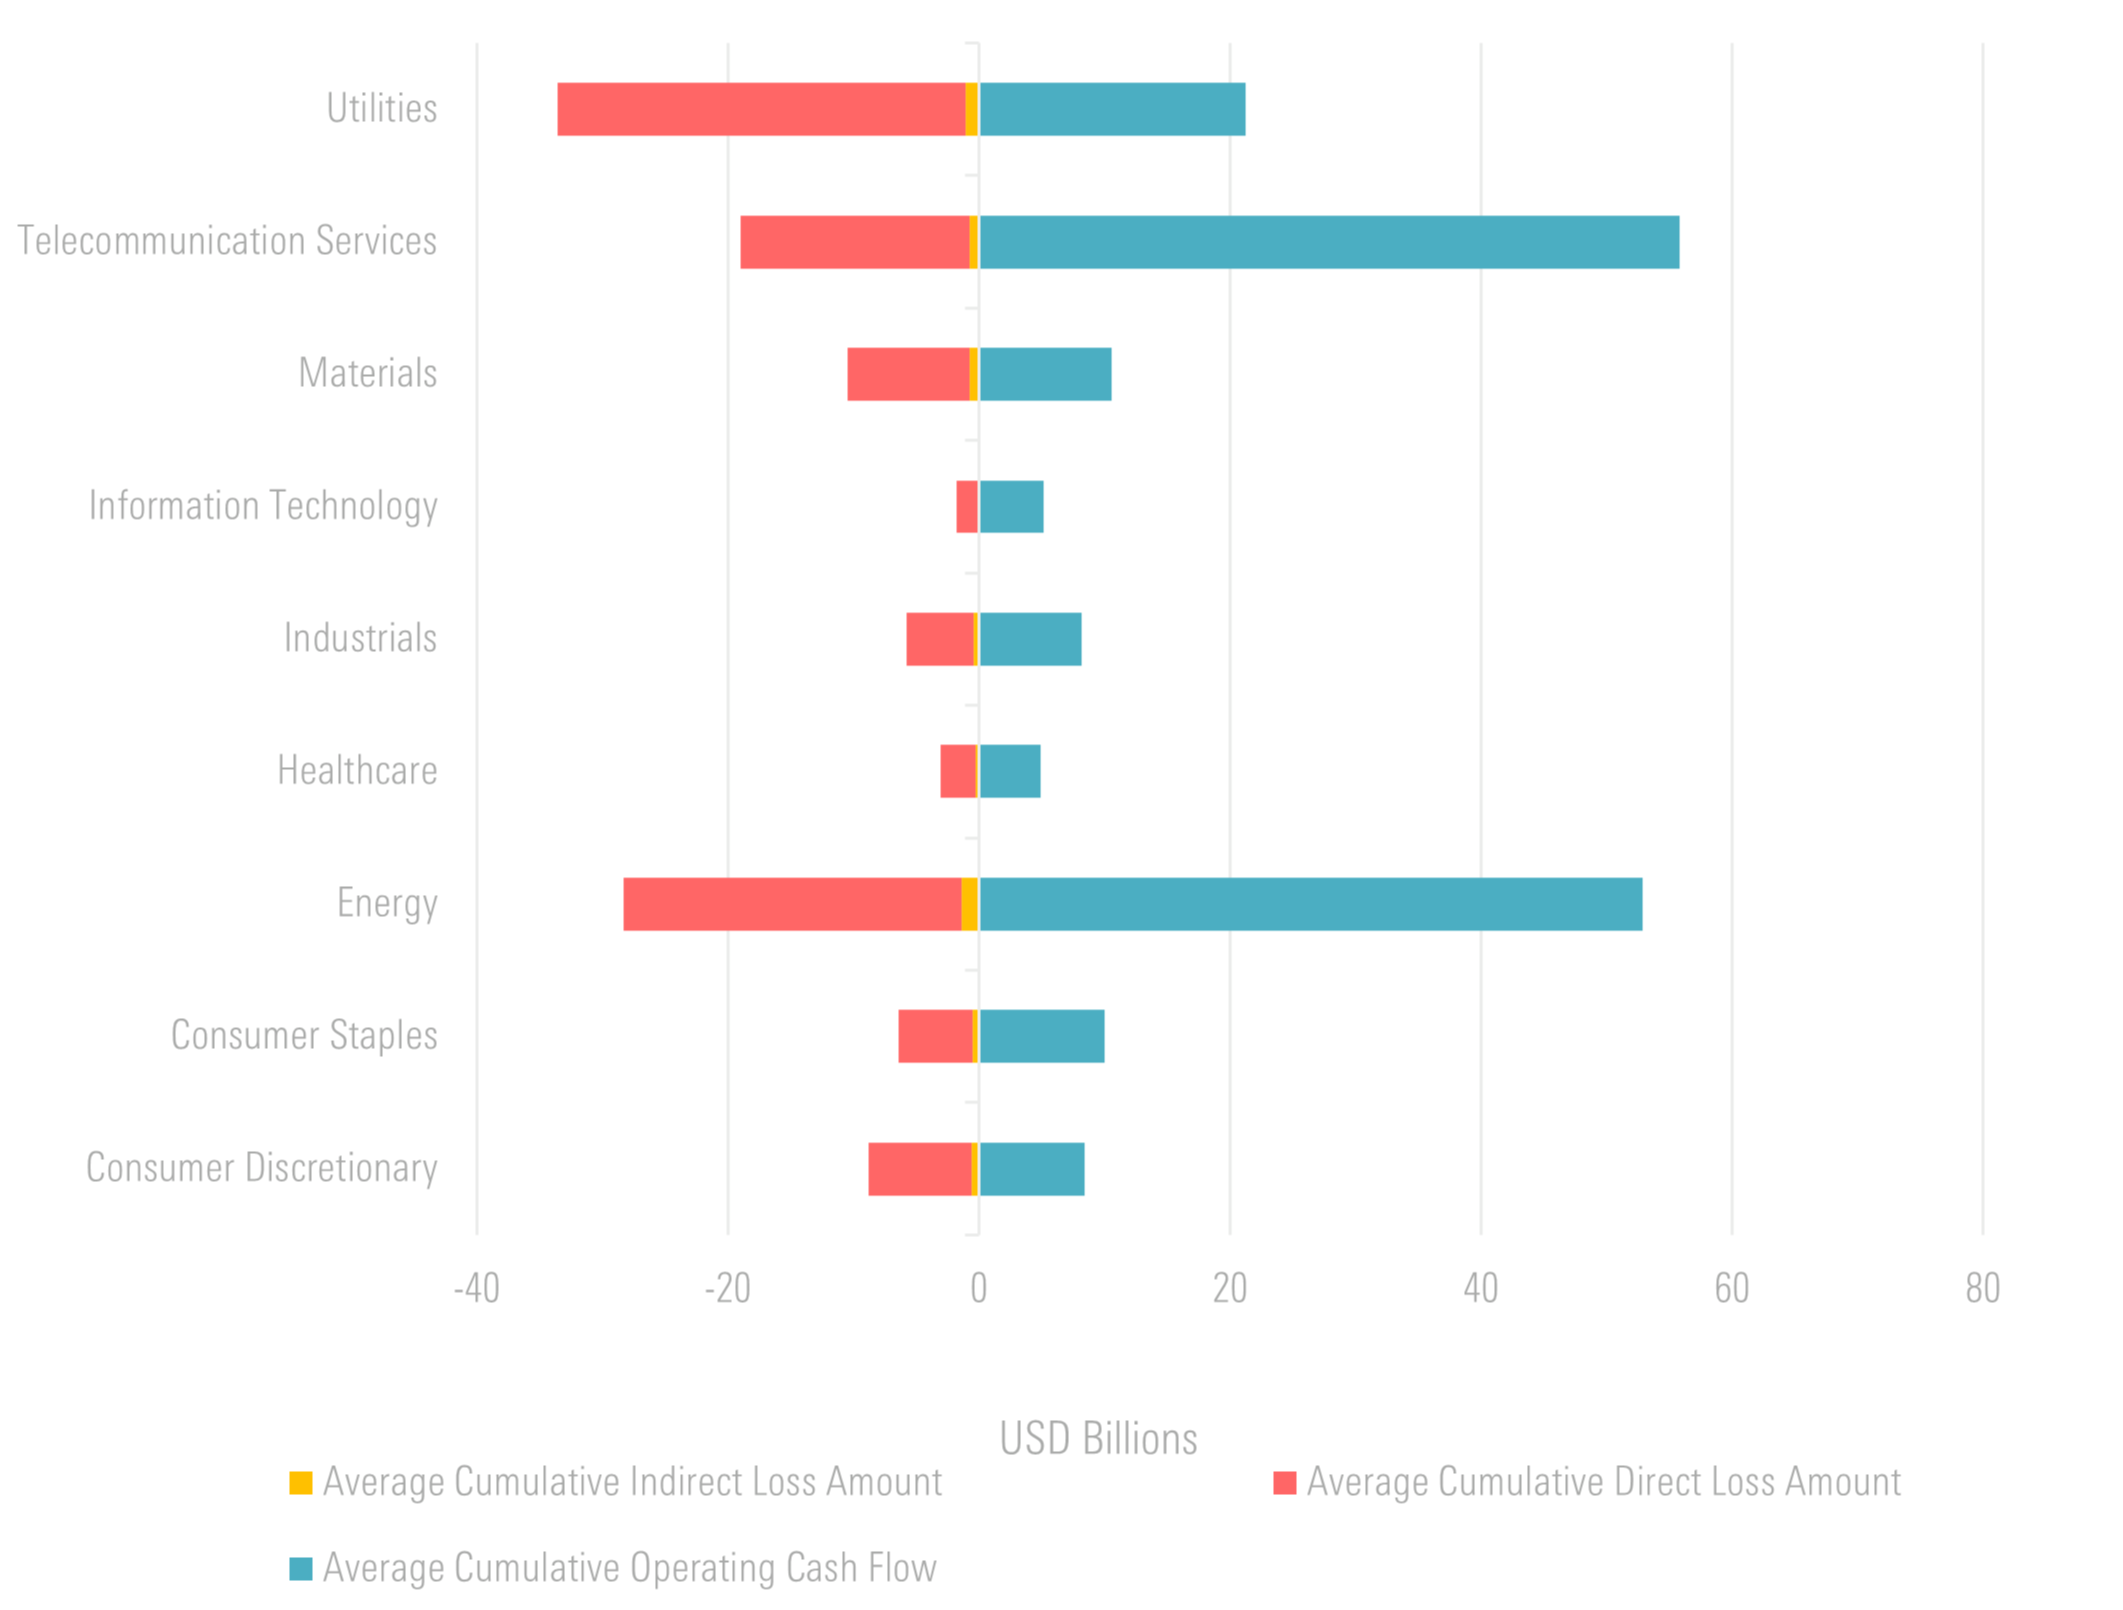
Source: Morningstar Sustainalytics. For informational purposes only.
Direct and Indirect Physical Climate Risks Defined
Material financial impacts of physical climate risks can be categorized into direct and indirect risks. Direct physical climate risks include things like impairment costs and productivity loss. For example, a grain processing plant that is damaged by flooding. And wind will incur costs from repairing the building and equipment, as well as lost revenue from the associated downtime.
Indirect physical climate impacts can disrupt the supply and demand of the business value chain. In the grain processing plant example, if the plant itself is not damaged by flooding, damage to nearby railroads and highways that it relies on to receive and export its inputs and outputs would negatively impact its operating capacity. Both direct and indirect risks cover important sections of the business value chain for portfolio companies. And reporting frameworks such as the Taskforce for Climate-related Financial Disclosure (TCFD) have recognized the importance of capturing this full spectrum of risks.
Potential Losses Due to Direct Physical Climate Risks
Losses from direct physical climate risks include those resulting from impacts to assets that a company owns or leases. These losses can manifest themselves as either lost property values due to damage sustained to a physical asset. Or lost revenue resulting from interruptions in productive capacity.
In a hot house world scenario, the average company in Morningstar Sustainalytics’ Physical Climate Risk Metrics universe is expected to lose an equivalent $0.45 for every $1 of cumulative operating cash flow due to these direct risks, between now and 2050. The same dataset reveals significant variation between companies, as well as between sectors. Depending on their locations, regional revenue, and asset values.
For example, the average information technology company in the Physical Climate Risk Metrics product universe will only lose about $0.16 for every $1 of operating cash flow between now and 2050 due to direct risks (Direct Loss Ratio of 0.16). While the average energy company in the product universe can expect to spend approximately $0.58 for every $1 of operating cashflow on these direct risks during the same period (Direct Loss Ratio of 0.58) (See Figure 2 below).
Figure 2: Average Direct and Indirect Loss Ratios by Sector In a Hot House World Scenario (RCP8.5)
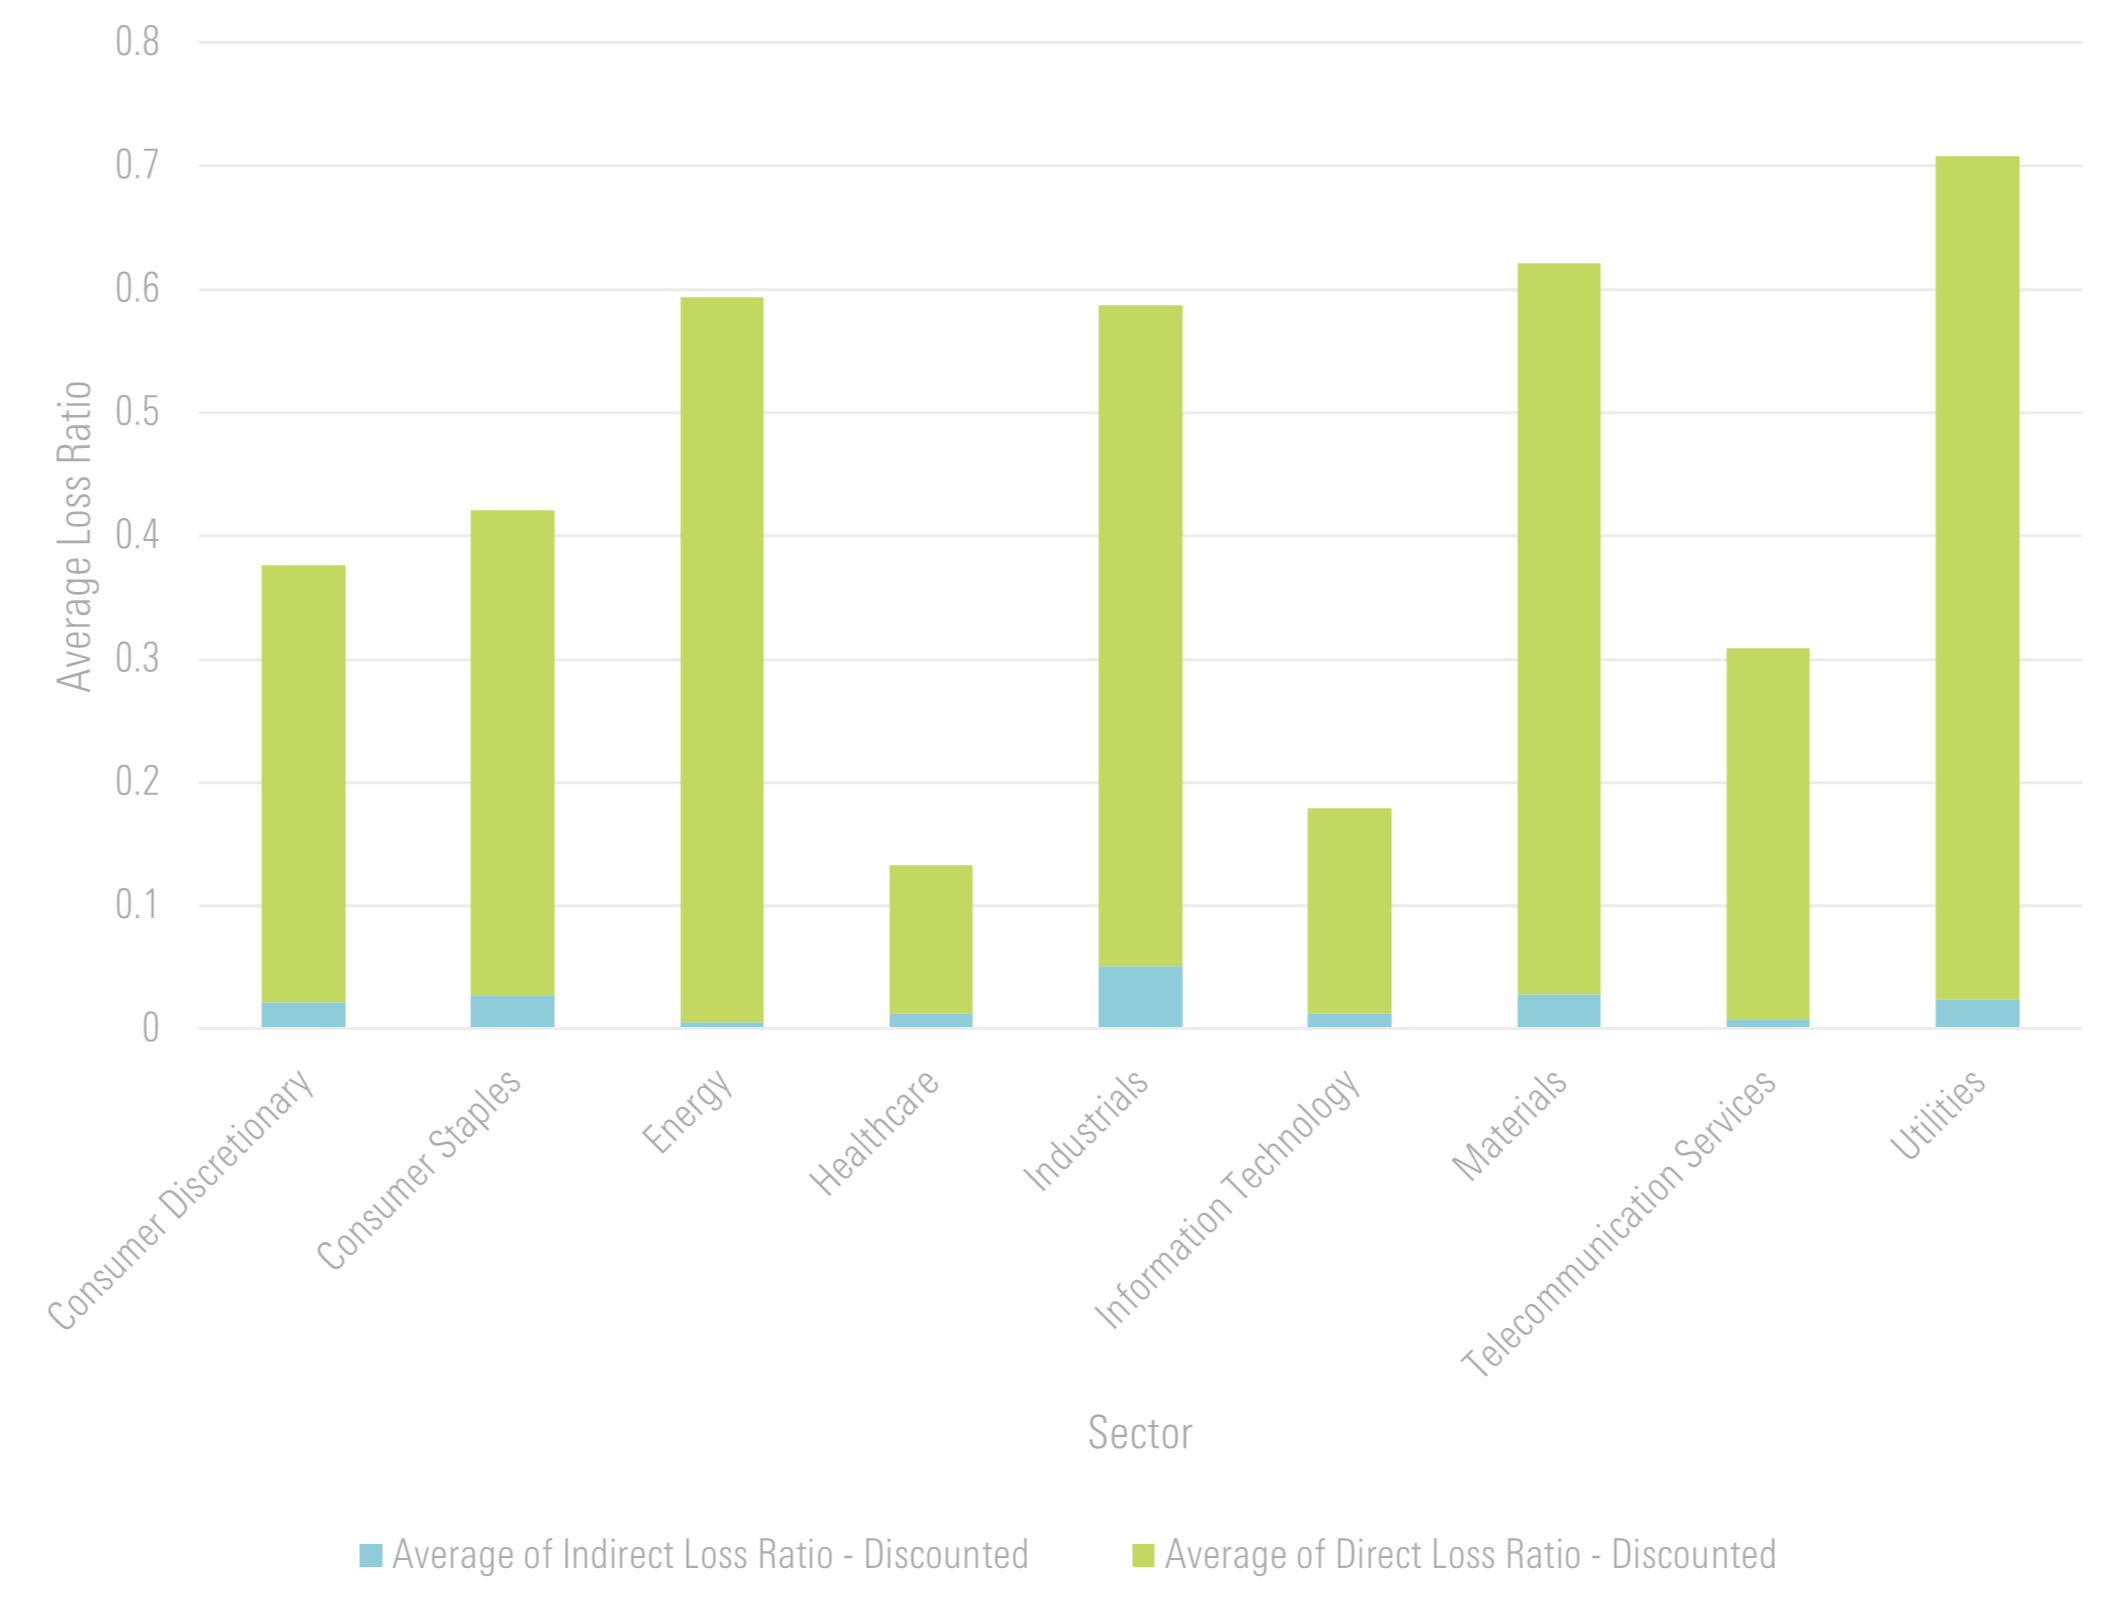
Source: Morningstar Sustainalytics. For informational purposes only.
*Note that Indirect Loss Ratio covers the risks to local critical infrastructure surrounding an asset. But does not yet include risks to a company’s full supply chain.

Impacts
While direct physical climate risks are difficult to quantify, indirect physical climate risks are even more so. Indirect physical climate risks affect the services and resources a company uses, but does not own or control. These risks primarily impact the productive capacity of a company’s assets and can affect both upstream and downstream operations. Damage to critical infrastructure in the region surrounding an asset. Such as an electric substation or water purification plant. For example, could impede a company’s ability to operate effectively.
Other examples of how indirect risks affect companies include impacts to the global supply chain as well as to regions and nations. Increasingly interconnected global supply chains and the common use of just-in-time manufacturing systems leave companies vulnerable to disruptions in production and shipping around the world. Companies operating in regions and countries that experience damage from physical hazards are also exposed to volatility in supply and demand, and disruptions to their workforce.
Similar to scope 3 GHG emissions, investors need ways to assess the risks to a company across the business value chain. By studying a company’s exposure to indirect physical climate risks. Investors can understand how external forces can affect a company in the regions in which they operate.
For example, in 2021, floods in British Columbia, Canada, washed out rail lines. Causing grain producers, transporters, and processors to experience interruptions in access to supply chains.2 In that same year, the Caldor Fire in California cost an estimated tens of millions of dollars in lost economic activity within a single county due to smoke, evacuation, and supply chain interruptions. Even though no buildings were damaged in that county.3 In 2022, heat waves in the United Kingdom caused cooling systems to fail at Google’s data centers, impacting clients throughout Europe.4 Risks like these, among others, will continue to grow in severity and frequency as climate change worsens.
Why Investors Need to Pay Attention Mounting Physical Climate Risks
Countries, stock exchanges and industry groups are adopting regulations that require companies. And institutional investors to report and disclose their exposure to physical climate risks in alignment with the TCFD’s framework. As these jurisdictions expand the data that is available on physical climate risks. Investors will be able to make more sophisticated decisions to manage their exposure to these risks, similar to how available GHG emissions data allows better decision-making around transition risks.
The expectations around how investors should integrate physical climate data into risk management are also growing in sophistication. This is perhaps most evident in the increasing granularity of risk management. And business strategy disclosures in regulations like the European Banking Authority Pillar 3 disclosures and the UK Financial Conduct Authority’s TCFD reporting requirements. A working paper from the European Central Bank5 shows that markets are already beginning to price in physical climate risks, albeit at the sector level rather than the issuer level. By leveraging more comprehensive bottom-up information about companies. Investors can leverage physical climate risk data as a competitive advantage in a challenging market.
Watch our Physical Climate Risk Metrics video to learn more about the insights these metrics can give investors into the financial resiliency of their portfolio companies.
References
1 See https://riskfactor.com/
2 Atkins, E. and McGee, N. 2021. “Canada faces grain backlog with freight halted through B.C. after flooding.” November 21, 2021. The Globe and Mail. https://www.theglobeandmail.com/business/article-canada-faces-grain-backlog-with-freight-halted-through-bc-after/.
3 Gedye, G. 2021. “How much do wildfires really cost California’s economy?” October 11, 2021. CalMatters. https://calmatters.org/economy/2021/10/california-wildfires-economic-impact/.
4 Swinhoe,D. 2022. “Google’s London data center outage during heatwave caused by ‘simultaneous failure of multiple, redundant cooling systems.’” August 2, 2022. DataCenterDynamics.com. https://www.datacenterdynamics.com/en/news/googles-london-data-center-outage-during-heatwave-caused-by-simultaneous-failure-of-multiple-redundant-cooling-systems/.
5 Bua, G., Kapp, D., Ramella, F, and Rognone, L. 2022. “Transition versus physical climate risk pricing in European financial markets: a text-based approach.” July 2022. European Central Bank Working Paper Series. https://www.ecb.europa.eu/pub/pdf/scpwps/ecb.wp2677~9fc49e8300.en.pdf.


Thank you for the auspicious writeup. It in fact was a amusement
account it. Look advanced to more added agreeable from you!
By the way, how can we communicate?
Thank you
Dear Website Owner,
I hope this email finds you well. I recently discovered your website and was impressed by the quality of your content and the helpful information you offer to your audience. In light of this, I would like to propose a backlink exchange that could benefit both our websites.
My website, https://m.cheapestdigitalbooks.com/, is focused on providing affordable digital books to readers around the world. We currently have a strong online presence with a Domain Authority (DA) of 13, a Page Authority (PA) of 52, and a Domain Rating (DR) of 78. Our website features 252K backlinks, with 95% of them being dofollow, and has established connections with 5.3K linking websites, with 23% of these being dofollow links.
I believe that a mutually beneficial backlink exchange could be of great value for both of our websites, as it may lead to an increase in website authority and improve our search engine rankings. In this collaboration, I am willing to add backlinks from my website using your desired keywords and anchor texts. In return, I would be grateful if you could include backlinks with my desired keywords and anchor texts on your website.
I kindly request that you visit my website, https://m.cheapestdigitalbooks.com/, to get a sense of the potential benefits this partnership could bring to your site. I am confident that this collaboration will provide a win-win situation for both parties, and I look forward to learning more about your thoughts on this proposal.
Thank you for considering my offer. I am excited about the potential growth this partnership may bring to our websites and am eager to discuss the details further. Please do not hesitate to reach out to me at your convenience.
Best regards,
David E. Smith
Email: david@cheapestdigitalbooks.com
Address: 3367 Hood Avenue, San Diego, CA 92117
Hi team ,
Thank your feedback